Thursday, January 12, 2012

11 Jan 2012 "surprise" tornadoes in North Carolina


Yesterday's EF2 tornadoes in Rutherford and Burke counties of western North Carolina (see photos above) injured 10-15 people (one critically) and came as a bit of a surprise. This case is a good example of how difficult it is to forecast winter-time tornadoes. Instability (CAPE) is often small (around 500 J/kg or less), but wind shear and low-level storm-relative helicity (SRH) are often large (> 200-300 m2/s2); that makes it hard to assess when CAPE and SRH combinations are truly strong enough to support significant tornadoes. It's just as important to assess the strength and focus of the accompanying synoptic setting and how the CAPE/shear environment fits with that.

Wednesday's system (1/11/12) had been a mid-level cut-off low over Texas the previous day (1/10/12, see NAM 500 mb vorticity charts above), and was being pushed rapidly into the Carolinas by a larger wave at 500 mb digging into the Central Plains. Note that although Wednesday's upper system over the Southeast was no longer a closed low, it was now a tight and dynamic short wave with a strong vorticity max moving into the western Carolinas (red area and "X", see arrows), focusing upward forcing. This strong upper wave and vorticity max had also caught up to the associated surface front (blue curved line), addiing to the strong dynamic focus in the western Carolinas area. (The previous day, the same upper vorticity max located in Texas had lagged the surface front in Mississippi by some distance.)

The fixed-layer Sig Tor Parameter at 2100z (STP at 4 pm EST, see SPC mesoanalysis chart above) suggested a marginally favorable environment (> 1.0) for tornadoes over NW South Carolina inching into SW North Carolina, just ahead of the strong upper vorticity center seen earlier and the surface front, near the "triple point" where fronts met (see surface inset). These dynamic factors and environment provided enough focus for the south end cell of a broken arc of low-topped storms (see visible satellite image above) to become a damaging tornadic supercell as it moved into North Carolina.

A similar setting the day before over Mississippi, but with somewhat less focus and slightly less favorable STP values (not shown), did not generate any tornadoes, illustrating how subtle and difficult winter tornado settings with small CAPE can be to assess, in contrast to days like the Joplin tornado where CAPE exceeded 4000 J/kg. Again, an awareness of how synoptic features come together or focus into a particular area (e.g., strong short wave and vorticity max, frontal orientation relative to those features, along with prefrontal environment) is important. Typically, STP or EHI values slightly larger than 1.0 aren't impressive, but the surface and upper-air dynamic focus in this case suggested more attention.

A 2200 UTC RUC-estimated sounding at Shelby NC, about 20 minutes before the first tornado, is shown in the last graphic above. Notice that the CAPE was small (< 500 J/kg), but the SRH moderate to strong (260 m2/s2). With all the CAPE "compressed" below 400 mb (approximately 24,000 ft MSL), rapid supercell updraft accelerations may have been enhanced in low-levels, even though total CAPE was relatively small, helping with tilting and stretching of streamwise vorticity associated with SRH in the environment.

Jon Davies - 1/12/12

Saturday, December 31, 2011

The 2011 tornado death toll - 2nd worst in U.S. history!


Here we are on the last day of 2011, and the U.S. tornado death toll for the year is at least 552, tied with 1936 as the 2nd deadliest U.S. tornado year! (The number of deaths may be even higher depending on how one categorizes them; the city of Joplin lists 161 tornado deaths for the May 22nd tornado instead of the National Weather Service "official" number of 158 deaths, probably due to how NWS categorizes some deaths as "direct" vs "indirect".)

I don't think most people who hear this in passing on TV comprehend how huge this is. In this day and age, that number is incredibly sobering! (See how dramatically 2011 stands out in the chart above among the last 50 years of U.S. tornado deaths.) Many of my colleagues, myself included, thought we would never see such huge death tolls again with the warning systems that are now in place in our country.

Given the violent tornadoes in 2011, without our warning systems, the death toll in 2011 would certainly have been worse. But I also think things could be better. The NWS assessment from Joplin earlier this year concluded there is considerable "desensitization" to warnings in our population from perceived overuse of sirens and warnings.

There obviously aren't easy answers. Some quick random thoughts with the new year upon us:

- Continued and ongoing public education is clearly needed about the importance of severe weather awareness and safety.

- Though not talked about much, siren policies across the country could be more standardized and less confusing... there are big inconsistencies regarding how sirens in different areas are used and activated. For example, some cities such as Joplin run them in shorter 3-minute bursts and then stop (as on the Joplin tornado day) which can be confusing to people in the most dangerous situations (when the sirens stop, is the danger past?), while other cities run them longer. And in many metro areas, sirens tend to be an all or none proposition until technology is installed to activate them only for localized areas directly threatened by an approaching tornado. Siren policies and equipment (as well as the NWS interface with those who activate them) appear to need closer examination and standardization between local governments so we don't inadvertantly train our citizens to ignore them due to a perceived "cry wolf" factor.

- If the NWS endorses use of "tornado emergency" statements to alert populated areas of imminent danger to life, then they can be more consistent in using them. If there was ever a situation that cried out for a tornado emergency statement conveying increased urgency, it was Joplin last May 22nd where 161 people died. But none was issued. By around 5:38 pm when the tornado was entering Joplin (about 20 minutes after a standard-worded "radar-indicated" tornado warning and 3 minute siren burst), there was enough information from radar and spotters to quickly issue a strongly-worded tornado emergency statement for local Joplin media, adding urgency and emphasis in a dangerous life-threatening situation. This would have been timely enough to possibly save some additional lives in spite of the hard-to-see and rapidly-developed violent tornado. The tornado warning was reissued at 5:48 pm with much stronger wording, but why wasn't an urgent tornado emergency statement issued 8 to 10 minutes earlier?

I hope some lessons from last year's tornado disasters (unprecedented for our modern technological age) result in growth and learning for all of us, as well as better tools and preparedness in 2012.

Jon Davies - 12/31/11

Wednesday, November 30, 2011

Don Harman


Some extremely sad news today... Long-time Kansas City meteorologist and weathercaster Don Harman died yesterday. He worked at WDAF-TV since 1999, and was very popular on their morning show.

Don had an awesome sense of humor, both on-air and off. He was always enthusiastic about weather, very knowledgeable, and a great communicator. My wife Shawna and I always enjoyed watching him on TV, as well as seeing him at AMS meetings, and have fond memories of the time a few years ago when he interviewed us about our kids book on storm chasing. He was a friend, and we are quite taken aback today at his passing.

With all the posts and discussion Shawna has been monitoring today on Facebook, it is clear that Don was an important part of KC area mornings for many many people, and will be missed beyond words. No one can replace him.

Our hearts and thoughts go out to Don's family and little girl, as well as the staff at WDAF. I can't imagine what they are feeling right now. This is a huge loss...

- Jon Davies 11-30-11

Monday, October 3, 2011

Some further comments about SRH & CAPE in tornado nowcasting


I've gotten some private responses and discussion about my post last week regarding the Joplin tornado and the use of SRH (storm-relative helicity) and CAPE combinations to assess "more dangerous' tornado enivronments.

Here's excerpts from one response by John Farley, an experienced storm chaser in the western IL/eastern MO area:
"...one problem with what [Jon] is suggesting regarding enhanced warning wording in situations with unusually favorable environments for strong tornadoes might have the unintended effect of contributing to the false alarm problem. I am referring... ...to situations with unusually favorable parameters and tornadic radar signatures, but no "ground truth" confirmation of actual tornadoes at the time the warning is issued... ...On the same day [as Joplin]... ...I was chasing east of Hermann, MO, (west of STL) where the SRH was 300 and the CAPE was 3000. I observed three supercells between around 4 and 7 p.m. that day, two of which were TOR-warned... ...The storm in that area on Jon's 5 p.m. image is the second of the three I observed... I observed strong rotation in this storm, but neither it nor any of the three supercells I observed ever produced a tornado..."

John makes an excellent point. It is a gross-oversimplification to use only the 2 parameters I've discussed so far (SRH and CAPE) for assessing supercell tornado environments. There are most certainly other important ingredients and issues to look at. The situation John has outlined also is a reminder that the decision to use enhanced wording or a "stronger warning" is not simple.

Let's look again at May 22nd, this time at the area where the storms John observed occurred. The 1st graphic above (from my previous post, but with arrows indicating the storm area west of St. Louis) confirms that CAPE and SRH were also large over eastern Missouri at late afternoon on the Joplin day, and would fall well above the red curve on my scatterdiagram (not shown). The 2nd graphic above (also repeated from my previous post) also shows the CAPE and SRH axes on May 22nd from a wider view, as well as EHI (energy-helicity index, combining the two parameters into a single dimensionless number), with the eastern MO storm area indicated by small black arrows. All this information suggests that potentially deadly supercell tornadoes were also possible in eastern Missouri, with large CAPE/SRH/EHI indicated here. But as John noted, tornadoes did not occur, even though storms were rotating.

A closer look at both graphics also shows that the storm area west of St. Louis, unlike the Joplin storm, was on the eastern side of the instability axis moving _away_ from the largest helicity and largest CAPE, and moving _toward_ an area of increasing MLCIN (light blue; SBCIN was even larger near St. Louis, not shown), suggesting some increasing low-level stability as storms moved toward the Mississippi River. Strong tornadoes can certainly occur on the east side of an instability axis, but are almost always near a warm front or within an area of warm advection in low-levels (increasing warmth and moisture) where SRH grows _larger_ as one moves east or northeast into or across the warm advection area. Notice that this was _not_ the case on March 22 in eastern MO, where SRH was trending downward some in value toward the St. Louis area.

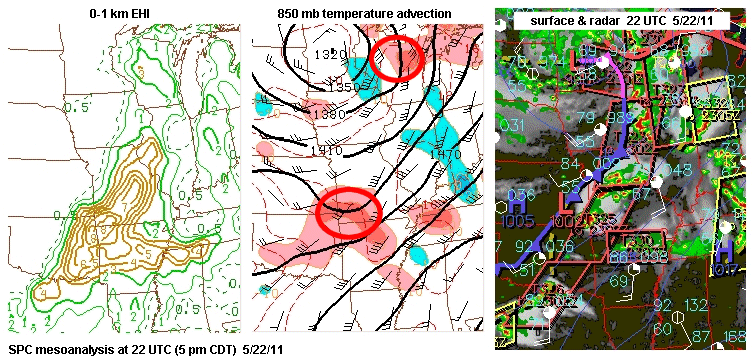
To look further at warm advection, the 3rd graphic above is again the Joplin day at 5 pm CDT (22 UTC), while the 4th graphic is 2 days later on 5/24/11 at 5 pm CDT for comparison; both EHI and temperature advection at 850 mb from the SPC mesoanalysis are shown in these 2 graphics, along with surface and radar features. Notice on both graphics, strong warm advection (indicated in pinks and reds) was co-located with the instability/EHI axes where violent tornadoes occurred in southwest MO (the 22nd) and central OK (the 24th), respectively. Also notice that on 5/22/11, the warm advection area was well removed to the southwest from the St. Louis area. In my database work, I've found that the stronger tornadoes are usually associated within or immediately to the south of strong warm advection areas, where lifting and SRH tend to be larger because of the associated atmospheric processes, along with increasing CAPE.

Certainly, the positioning of the storm John was following, on the eastern side of the instability axis and away from the strong warm advection, would not preclude tornadoes from occurring, and a responsible meteorologist should clearly warn on a storm in that environment (as was done) _if_ significant rotation was indicated by radar and/or spotters. But the surface pattern on the 22nd, showing a surface low back in southeast Kansas with increasing SRH and convergence along with enhanced warm advection and energy focus in southwest MO, might suggest that the better potential for strong tornadoes would be there. Adding to this the maximized combinations of SRH and CAPE, southwest MO would be a "red flag" area for possible stronger wording in tornado warnings at late afternoon, while this would appear less true for eastern MO, given the location relative to the instability axis, warm advection, and surface/low-level pattern focus farther southwest.

Again, to be clear in my recent posts, I'm not suggesting that we are able to forecast tornado intensity. And I'm not suggesting that enhanced wording in warnings be used every time SRH and CAPE appear to be in the "more dangerous" part of the scatterdiagram. But I am suggesting that we can detect and see at least some settings where stronger tornadoes are _more likely_. That involves knowledge of surface patterns where winds are backing and the atmosphere is focusing, where warm advection is occurring, thus increasing SRH and CAPE, along with other ingredients. That's a lot different than just looking at points on a diagram; it involves some understanding of important processes in severe weather production and a sense of atmospheric trends and evolution over an area being monitored. On the Joplin day, getting away from the SRH/CAPE points on a scatterdiagram, the atmosphere's _focus_ at late afternoon using surface and other basic weather products appeared rather impressive over southwest MO; look at the strong warm advection east of the surface low in the 3rd graphic above, and the "bulging" EHI pattern back to the northwest east of the surface low. The increasing SRH and CAPE values in this area just "sealed the deal", environment-wise.

Chuck Doswell has written extensively about the danger of using "magic" numbers and indices in weather forecasting. Isolated numbers, indices, and points on diagrams have _no place_ in forecasting without basic knowledge and thoughtful consideration of other issues, such as the surface pattern focus and evolution, along with other ingredients. I apologize if I gave any impression otherwise, when I was oversimplfying using the SRH and CAPE diagram to make a point in limited space. I'll write more about this in future posts.

Thanks, John, for sharing the situation above along with your thoughts and discussion.

- Jon Davies 10-1-11

Monday, September 26, 2011

An additional look at the Joplin tornado, after the assessment report


The NWS assessment report for the Joplin tornado came out last week (see here and here), 4 months after this horribly tragic event. I was glad to see that the authors of the report picked up on the public perception of high false alarms, and their tendency to ignore warnings and sirens because of an optimistic bias and the perception that "they happen all the time" in southwest Missouri. I was also glad to see some discussion in the report about the possibility of different tiers of warnings, and even different siren tones or patterns to get people's attention in situations that are truly more deadly. These are some things I touched on (particularly a two-tiered warning system) in a discussion I posted at the very tail end of July.

Given the broad environment area of sizable low-level shear and large CAPE present at late afternoon over southwest Missouri on May 22, when significant storm rotation was detected on radar in that environment, particularly moving toward a populated area like Joplin, that would have been a good situation for the use of enhanced wording or even a "higher tier" of warning. And, even though the tornado developed very fast on the southwest edge of Joplin 17 minutes after a tornado warning with standard wording had been issued, it seems possible that if more urgent action had been performed rapidly around 5:40 pm when the first tornado reports were coming in (e.g., a "tornado emergency" statement or reissuing of the tornado warning with more urgent wording prompting continuous sounding of sirens at that point), some additional lives might have been saved.

With the Joplin report now out, this is a good time and context to go back and look at the Joplin setting using SPC mesoanalysis graphics, which are generally good estimates of parameter patterns and ingredients useful in various types of weather forecasting. The first graphic above shows MLCAPE (mean-layer CAPE) and 0-1 km SRH (storm-relative helicity) graphics at 20 UTC (3 pm CDT) on 5/22/11 after the first storm had developed in southeast Kansas near Parsons (black arrow). Notice that while MLCAPE was quite large (> 4000 J/kg), 0-1 km SRH appeared rather unimpressive at this point (around 100 m2/s2). The 2nd graphic above shows the same paramaters, but 2 hours later at 22 UTC (5 pm CDT) about 30 minutes before the Joplin tornado. Notice that MLCAPE was still very large, but 0-1 km SRH had _increased dramatically_ ahead of the supercell complex approaching Joplin (black arrow), more than _doubling in value_ to greater than 250 m2/s2!

Looking at a SRH/CAPE scatterdiagram (3rd graphic above), notice how this low-level shear increase moved the SRH/CAPE data point from below the red curve upward to _well above_ it. This trend was very important, probably helped by a surface low forming over southeast KS (4th graphic). This should have been noted by any mesoscale analyst working as support to radar/warning meteorologists in the southwest MO/northwest AR/northeast OK area that afternoon. Even though no tornadoes had occurred yet in the s.e. KS/s.w. MO area, such an increase would be a red flag for considering the use of enhanced wording in warnings (or a higher tier of warning, if such a system were implemented) based on any significant rotations detected on radar in such an environment, particularly if a very populated area (such as Joplin) were threatened.

Let's contrast the Joplin setting with a situation that occurred at midday in Kansas City on 5/25/11, 3 days later. The last graphic above shows CAPE (11 pm CDT) and SRH (noon CDT), similar to the earlier graphics, though SBCAPE (surface-based CAPE) is used due to the "cold-core" nature (500 mb closed low nearby) of the setting where SB lifted parcels are typically more representative of true instability. Note that SRH was quite meager (around 50 m2/s2), and CAPE was less than 1500 J/kg in the immediate Kansas City area (left black arrows in last graphic above), with the resulting position on the same SRH/CAPE diagram above far to the lower left _well below_ the red curve. Although it is quite possible to get small short-lived tornadoes in such settings, strong "cold core" tornadoes are almost always linked to settings with much larger SRH. Indeed, there were 2 or 3 reports of brief weak tornadoes from south to north across the KC metro area, but certainly no significant damage. Compared to Joplin, the threat over the Kansas City area was small in this situation. But tornado warnings with wording not much different than the intial Joplin warning 3 days earlier prompted several people in KC to call my wife Shawna and me in panic to ask what was going on, given that Joplin had occurred only a few days earlier. We told people to take cover and precautions, but that the risk was only a small fraction of what it had been for Joplin. This is an example of a situation where 2 tiers of warnings (and possibly different siren modes) might be useful in conveying the relative threat to the public.

Admittedly, the Kansas City situation on 5/25/11 was complicated by the rapid increase in parameter values and support for tornadoes some 70 to 80 miles east-southeast of Kansas City, where a significant EF2 tornado hit Sedalia just after noon. With SRH in the 150-200 m2/s2 range and SBCAPE near 2500 J/kg in the Sedalia area and southeastward (see right black arrows on last graphic above), the SRH/CAPE potential was very close to the red curve on the SRH/CAPE diagram above, signaling a much greater tornado threat there. So the May 25th situation was not a simple one to assess. But use of the tools above were definitely helpful in indicating the increased tornado threat and tornado risk as one moved well east and southeast of Kansas City.

To be clear, I do understand and know that there are many, many tornado warning situations where it is essentially impossible to distinguish between warning and not warning using radar in combination with environment conditions... in those cases the environments are simply too "borderline" to make such calls given the knowledge and observing situations we have. BUT, there are also situations where tornado environment parameters are clearly impressive as thunderstorms form, suggesting increased risk of death and injury over larger areas. Those are the times when we need to do everything we can to convey the true risk to the public.

I do also know that many people still don't seem to know the difference between a watch and a warning (maybe the term "alarm" instead of "warning", avoiding the "waa.." word sound confusion between the two words, would be better?). So I often get arguments that much of our populace is too "dumbed down" to deal with a 2-tier warning system. But is that really a reason to continue status quo in our current system when today's technology and knowledge can offer more information in many warning situations? That is something to think about.

- Jon Davies 9/26/11

Monday, August 15, 2011

The 8/13/11 Indiana stage collapse -- an example of severe weather safety issues at a large public venue


Saturday evening's stage collapse due to strong gust front winds at the Indiana State Fairgrounds in Indianapolis killed 5 people and finished off a week when several people were killed in the U.S. as a result of thunderstorm winds. On Aug. 7, 1 person was killed in southern Missouri when a tree blew onto their car; on Aug. 9, a UPS driver was killed in northeast Indiana when a tree fell on his truck, and on Aug. 10, a woman was killed east of Tulsa OK when thunderstorm winds destroyed a mobile home (this may have been a brief non-supercell tornado from a bow echo on radar). This all serves as a reminder that severe thunderstorm/squall line winds can and do kill people.

Concerning Saturday's Indiana State Fair tragedy, here's what my wife Shawna posted on Facebook:
"The Indiana Governor called last night's stage collapse a "freak accident". I respectfully disagree. That was a make shift stage sitting right in the path of that gust front. It doesn't take a genius to know it was disaster in the making (especially when you see Ernie Mill's photos of the shelf cloud as it approached). The concert should have at least been delayed once the warning was issued (10 minutes out) with an orderly evacuation AWAY from that stage. Very sad and preventable incident. It's also another reminder that we in the weather community need to continue to educate the public about weather awareness."

I agree... At 8:39 pm EDT, NWS had issued a warning for Indianapolis concerning thunderstorm winds in excess of 60 mph a full 10 minutes before the storm struck the fairgrounds at around 8:50 pm EDT, and severe thunderstorms had been in the area west of Indianapolis approaching for more than an hour before (see radar images above). A shelf cloud (a visual "red flag" to watch for strong wind gusts, see Ernie Mill's photos above) was quite visible as the thunderstorm gust front approached the fairgrounds. A full evacuation wasn't practical or even necessary, but certainly it should have been clear that the _temporary_ stage structure with its top-heavy lights was a dangerous place to be around in strong winds. The deaths all occurred in the first several rows as the stage structure collapsed. Someone at a microphone should have emphatically told concertgoers seated within a couple hundred feet of the stage to at least move back well away from the stage structure _before_ the gust front hit; that much would not have been difficult to do. From this perspective, Saturday's tragedy was preventable and certainly not a "freak accident" or "fluke".

At all public outdoor venues that involve thousands of people, the organizers/managers of the event on-site need to be in consistent touch with a meteorologist or weather-knowledgeable person regarding any potential severe weather that may be approaching, even if it is many miles away yet. And a _clear_ communication line needs to be open to those on stage or in control of the public sound system at the event to let people know where to go in a timely manner before weather hits. While full evacuations may not be practical or possible, people definitely need to be warned and told to move away from dangerous _temporary_ structures that may collapse when gusty thunderstorm winds hit them. That seems like a no-brainer.

- Jon Davies 8/15/11

Saturday, July 30, 2011

Do we warn too much? Some thoughts on tornado warnings in this tragic year of tornado deaths...


It's been 2 months since the horrifying Joplin tornado (death toll now 159), and 3 months since the shockingly deadly tornado outbreak in the Dixie states that killed well over 300 people. It now looks like 2011 will be the 4th deadliest U.S. tornado year on record. I don't think most people have any idea how jaw-dropping that is... one has to go way back before a coordinated tornado warning system was in place to find annual tornado death tolls of that magnitude!

When big tornadoes hit cities, there will be deaths. And there have been many large long track tornadoes this year in populated places. But the staggering death tolls this year also raise some questions, including these: Are people getting complacent regarding severe weather preparedness? And do we now warn so much that warnings sometimes fall on deaf ears? A respected nurse at one of the hospitals in Joplin told me, "We get warnings and sirens all the time... we're, like, tone deaf... it's hard to take them seriously." I've heard many similar comments from other people. Severe weather education is a never-ending task that requires continued attention and priority, and getting people to listen and take action is deeply rooted in social science rather than meteorology.

It is noteworthy that, compared to the 1980s, the number of tornado warnings in some parts of the U.S. (such as the Southeastern states) has increased at least seven or eight-fold, according to a recent article in the Birmingham News, while false alarms are averaging close to 80%. I know of no concrete social studies that have examined "warning fatigue" regarding tornadoes and severe weather. Yet I do agree with respected Birmingham TV meteorologist James Spann's recent comments that have stirred some controversy.

I continue to see a number of tornado warnings issued in marginal settings where, based on years of data and increased operational knowledge about tornado environments, the atmosphere can only support, at best, weak or brief tornadoes. In those cases, the threat is considerably less compared to days like the Joplin tornado event this year, and the Dixie Super Outbreak. Yet it is often difficult to discern the relative degree of threat or risk in the text of many warnings, whether read verbatim or presented via media such as television. I know that the National Weather Service (NWS) and television/media meteorologists have a sincere desire to save lives and have the public know about all weather threats. Yet I wonder if we shouldn't reaffirm that we can't warn or cover all severe weather events. Instead, shouldn't we make a stronger effort to emphasize warnings in those weather settings that clearly have potential to be truly dangerous to many people in populated areas? I'm no expert in social science, but with my background in severe weather research, here are some comments from a meteorological perspective.

The first graphic above shows combinations of low-level wind shear (storm-relative helicity or SRH) and instability (CAPE, or convective available potential energy). On the most simplistic/basic level, these are the most important environment ingredients linked to supercell tornadoes based on research over the past 25 years. On this graphic, I've plotted estimated SRH/CAPE points (using nearby RUC model analysis soundings) for 44 tornadoes that were associated with 4 or more deaths over the past 11 years. I've also drawn in a curve suggesting a rough lower "limit" to SRH/CAPE combinations that generally support tornadoes that can kill larger numbers of people; note that all events but one (98%) fell above this curve.

Looking now at a much larger database (2214 supercell soundings I've collected over the past 11 years, 90% associated with NWS tornado warnings), the 2nd graphic above shows the percent and number of both non-tornadic and tornadic supercells (tornadoes shown by EF-scale intensity) falling near and above the red curve in the first graphic, suggesting more favorable SRH/CAPE combinations for strong/violent tornadoes. Notice that, using the discriminating curve suggested by the first diagram, only 17% of the non-tornadic supercells were "false alarms", falling near or above the curve but not producing any tornadoes. But moving over to significant tornadoes (EF2-EF5), notice that increasing majorities of these supercells fell into the more "favorable" area above the curve. Using only this simplistic SRH/CAPE scheme in supercell settings, this suggests workable false alarm and detection rates for supercell tornadoes, not even considering other ingredients such as deep-layer shear, cloud base height, amount of convective inhibition, storm motion relative to surface boundaries, etc., that have been found relevant in tornado forecasting research.

This isn't really new information; forecasters at SPC have used SRH and CAPE combinations along with forecasts of other ingredients for years now when generating outlooks and watches for tornadoes. However, tornado environment ingredients seem to be used less consistently when actual tornado warnings are considered. This is supported by the first column of the 2nd graphic above, where tornado warnings (not shown) were issued for 984 of 1160 non-tornadic supercells, yet the SRH/CAPE environment for 83% of these cases fell below the red curve in the first graphic above. Certainly, supercells in SRH/CAPE environments below the red curve do produce tornadoes, but when they occur, the large majority (80-85% according to my database) are weak (EF0-EF1 intensity). When thunderstorms form and become supercells, it is the environment area above the red curve where the probability of deadly tornadoes increases dramatically.

My point is this: Shouldn't we place a much stronger emphasis on radar-based tornado warnings issued in settings where SRH and CAPE are in the area near and above the red curve in the first graphic above, even prior to confirmed spotter sightings?

There are a variety of ways to work toward this, including better environment awareness by meteorologists (the SPC mesoanalysis page is a great tool in this regard) when issuing and presenting warnings, stronger wording and importance placed on warnings when environments are in the enhanced SRH/CAPE area, and making the public more aware that there are different levels of danger in weather settings.

I know that many of my colleagues in the NWS work hard to incorporate environment information into tornado warning decisions, and that there are many times when it is very difficult to know when to hold back from issuing a warning, or to go ahead and "push the red button". Also, I know that meteorologists in today's media intensive society don't usually get rewarded for not warning in a marginal situation and avoiding a false alarm, but they are ruthlessly scrutinized when a notable severe weather event is missed. I'm not suggesting that we don't warn in marginal situations where tornadoes can still produce isolated damage and threat. I am saying, let's make sure to put the strongest emphasis on warnings in environments where ingredients appear more optimum for stronger supercell tornadoes, and try to be more clear about that to the public.

A 2-tier warning system that would use an enhanced danger "red flag" in larger SRH/CAPE combination situations would certainly be a more radical solution, and require more public education. But this could help hospitals, factories, and public venues make more informed decisions regarding costly labor-intensive sheltering in the more dangerous situations, and possibly reduce apathy from "false alarms". It also might help emergency managers make more informed decisions regarding the use of sirens, maybe running them longer and more consistently in "red flag" situations, or using different siren tones to catch people's attention.

Several of my colleagues have told me the above would be unworkable, and even confusing to the general public. That may be. But I do feel strongly that we can do more to help the public recognize warning situations that clearly have greater danger affecting more people. I can't avoid a strong sense that, with all the information and knowledge available to meteorologists today, we can do a better job conveying true tornado threats to the public and reducing false alarm perceptions that can engender public apathy. I think this is worth at least a look in this tragic year of tornado deaths.

In a future post, I'll discuss some recent example cases that relate to the above discussion.

- Jon Davies 7/30/11