


I've gotten some private responses and discussion about my post last week regarding the Joplin tornado and the use of SRH (storm-relative helicity) and CAPE combinations to assess "more dangerous' tornado enivronments.
Here's excerpts from one response by John Farley, an experienced storm chaser in the western IL/eastern MO area:
"...one problem with what [Jon] is suggesting regarding enhanced warning wording in situations with unusually favorable environments for strong tornadoes might have the unintended effect of contributing to the false alarm problem. I am referring... ...to situations with unusually favorable parameters and tornadic radar signatures, but no "ground truth" confirmation of actual tornadoes at the time the warning is issued... ...On the same day [as Joplin]... ...I was chasing east of Hermann, MO, (west of STL) where the SRH was 300 and the CAPE was 3000. I observed three supercells between around 4 and 7 p.m. that day, two of which were TOR-warned... ...The storm in that area on Jon's 5 p.m. image is the second of the three I observed... I observed strong rotation in this storm, but neither it nor any of the three supercells I observed ever produced a tornado..."
John makes an excellent point. It is a gross-oversimplification to use only the 2 parameters I've discussed so far (SRH and CAPE) for assessing supercell tornado environments. There are most certainly other important ingredients and issues to look at. The situation John has outlined also is a reminder that the decision to use enhanced wording or a "stronger warning" is not simple.
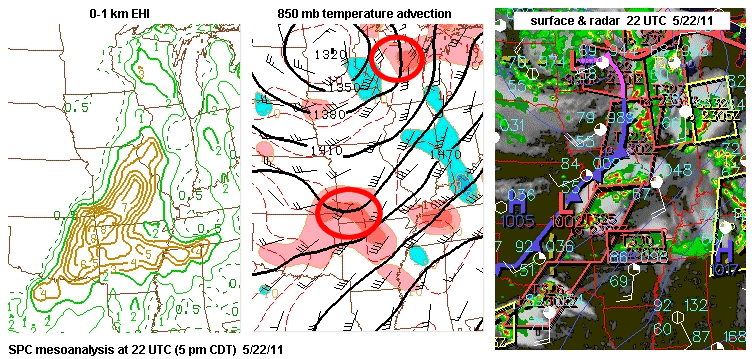
Let's look again at May 22nd, this time at the area where the storms John observed occurred. The 1st graphic above (from my previous post, but with arrows indicating the storm area west of St. Louis) confirms that CAPE and SRH were also large over eastern Missouri at late afternoon on the Joplin day, and would fall well above the red curve on my scatterdiagram (not shown). The 2nd graphic above (also repeated from my previous post) also shows the CAPE and SRH axes on May 22nd from a wider view, as well as EHI (energy-helicity index, combining the two parameters into a single dimensionless number), with the eastern MO storm area indicated by small black arrows. All this information suggests that potentially deadly supercell tornadoes were also possible in eastern Missouri, with large CAPE/SRH/EHI indicated here. But as John noted, tornadoes did not occur, even though storms were rotating.
A closer look at both graphics also shows that the storm area west of St. Louis, unlike the Joplin storm, was on the eastern side of the instability axis moving _away_ from the largest helicity and largest CAPE, and moving _toward_ an area of increasing MLCIN (light blue; SBCIN was even larger near St. Louis, not shown), suggesting some increasing low-level stability as storms moved toward the Mississippi River. Strong tornadoes can certainly occur on the east side of an instability axis, but are almost always near a warm front or within an area of warm advection in low-levels (increasing warmth and moisture) where SRH grows _larger_ as one moves east or northeast into or across the warm advection area. Notice that this was _not_ the case on March 22 in eastern MO, where SRH was trending downward some in value toward the St. Louis area.
To look further at warm advection, the 3rd graphic above is again the Joplin day at 5 pm CDT (22 UTC), while the 4th graphic is 2 days later on 5/24/11 at 5 pm CDT for comparison; both EHI and temperature advection at 850 mb from the SPC mesoanalysis are shown in these 2 graphics, along with surface and radar features. Notice on both graphics, strong warm advection (indicated in pinks and reds) was co-located with the instability/EHI axes where violent tornadoes occurred in southwest MO (the 22nd) and central OK (the 24th), respectively. Also notice that on 5/22/11, the warm advection area was well removed to the southwest from the St. Louis area. In my database work, I've found that the stronger tornadoes are usually associated within or immediately to the south of strong warm advection areas, where lifting and SRH tend to be larger because of the associated atmospheric processes, along with increasing CAPE.
Certainly, the positioning of the storm John was following, on the eastern side of the instability axis and away from the strong warm advection, would not preclude tornadoes from occurring, and a responsible meteorologist should clearly warn on a storm in that environment (as was done) _if_ significant rotation was indicated by radar and/or spotters. But the surface pattern on the 22nd, showing a surface low back in southeast Kansas with increasing SRH and convergence along with enhanced warm advection and energy focus in southwest MO, might suggest that the better potential for strong tornadoes would be there. Adding to this the maximized combinations of SRH and CAPE, southwest MO would be a "red flag" area for possible stronger wording in tornado warnings at late afternoon, while this would appear less true for eastern MO, given the location relative to the instability axis, warm advection, and surface/low-level pattern focus farther southwest.
Again, to be clear in my recent posts, I'm not suggesting that we are able to forecast tornado intensity. And I'm not suggesting that enhanced wording in warnings be used every time SRH and CAPE appear to be in the "more dangerous" part of the scatterdiagram. But I am suggesting that we can detect and see at least some settings where stronger tornadoes are _more likely_. That involves knowledge of surface patterns where winds are backing and the atmosphere is focusing, where warm advection is occurring, thus increasing SRH and CAPE, along with other ingredients. That's a lot different than just looking at points on a diagram; it involves some understanding of important processes in severe weather production and a sense of atmospheric trends and evolution over an area being monitored. On the Joplin day, getting away from the SRH/CAPE points on a scatterdiagram, the atmosphere's _focus_ at late afternoon using surface and other basic weather products appeared rather impressive over southwest MO; look at the strong warm advection east of the surface low in the 3rd graphic above, and the "bulging" EHI pattern back to the northwest east of the surface low. The increasing SRH and CAPE values in this area just "sealed the deal", environment-wise.
Chuck Doswell has written extensively about the danger of using "magic" numbers and indices in weather forecasting. Isolated numbers, indices, and points on diagrams have _no place_ in forecasting without basic knowledge and thoughtful consideration of other issues, such as the surface pattern focus and evolution, along with other ingredients. I apologize if I gave any impression otherwise, when I was oversimplfying using the SRH and CAPE diagram to make a point in limited space. I'll write more about this in future posts.
Thanks, John, for sharing the situation above along with your thoughts and discussion.
- Jon Davies 10-1-11